Customer Experience KPIs: 6 KPIs to Track in 2024
Measuring customer experience is vital for businesses today. Key metrics like satisfaction score, NPS, and churn rate are crucial. This guide explores essential customer experience KPIs, helping track and improve customer loyalty and lifetime value.

What Are Customer Experience KPIs?
Customer Experience KPIs, or Key Performance Indicators, are metrics used to gauge various aspects of a customer's interaction with a business. These KPIs encompass a range of data points, from customer effort score and satisfaction score to churn rate and lifetime value. They offer a snapshot of how effectively a company is meeting customer expectations and fostering loyalty.
At the core, these KPIs measure elements like how much effort a customer must expend to get their issues resolved (customer effort score), the likelihood of customers to recommend a brand (Net Promoter Score, NPS), and the overall satisfaction level of customers with a product or service (customer satisfaction score, CSAT).
By tracking these metrics, businesses can gain insights into the customer journey, understand the pain points in their service or product experience, and identify areas needing improvement. This process helps in retaining existing customers, reducing churn, and ultimately contributing to the company's success.
Why Are Customer Experience KPIs Important?
Understanding why Customer Experience KPIs are crucial is key to any business aiming for long-term success. These metrics offer a clear view into how customers interact with and feel about a company, directly impacting customer loyalty and retention.
Firstly, metrics like customer satisfaction score and net promoter score (NPS) are vital in assessing customer sentiment. Positive scores often correlate with increased customer loyalty, while negative feedback can signal areas needing improvement. By tracking these scores, businesses can tailor their strategies to enhance customer satisfaction and encourage repeat purchases.
Customer churn rate is another critical KPI, highlighting how many customers a business loses over a specific period. A high churn rate can be a red flag, indicating issues in the customer experience that might lead to lost revenue and a damaged brand image. Conversely, a low churn rate suggests strong customer loyalty and satisfaction.
Finally, understanding the customer effort score helps businesses identify and address friction points in the customer journey. By making it easier for customers to interact with the company, businesses can improve the overall customer experience, leading to higher retention rates and ultimately, greater business success.
In essence, Customer Experience KPIs are not just numbers; they are insights into the heart of a business's relationship with its customers. They guide companies in making informed decisions that not only retain existing customers but also attract new ones, ensuring a thriving, customer-centric business model.
Top Customer Experience KPIs to Track
In the realm of customer experience, certain KPIs stand out for their ability to provide actionable insights. Here are some top Customer Experience KPIs to track:
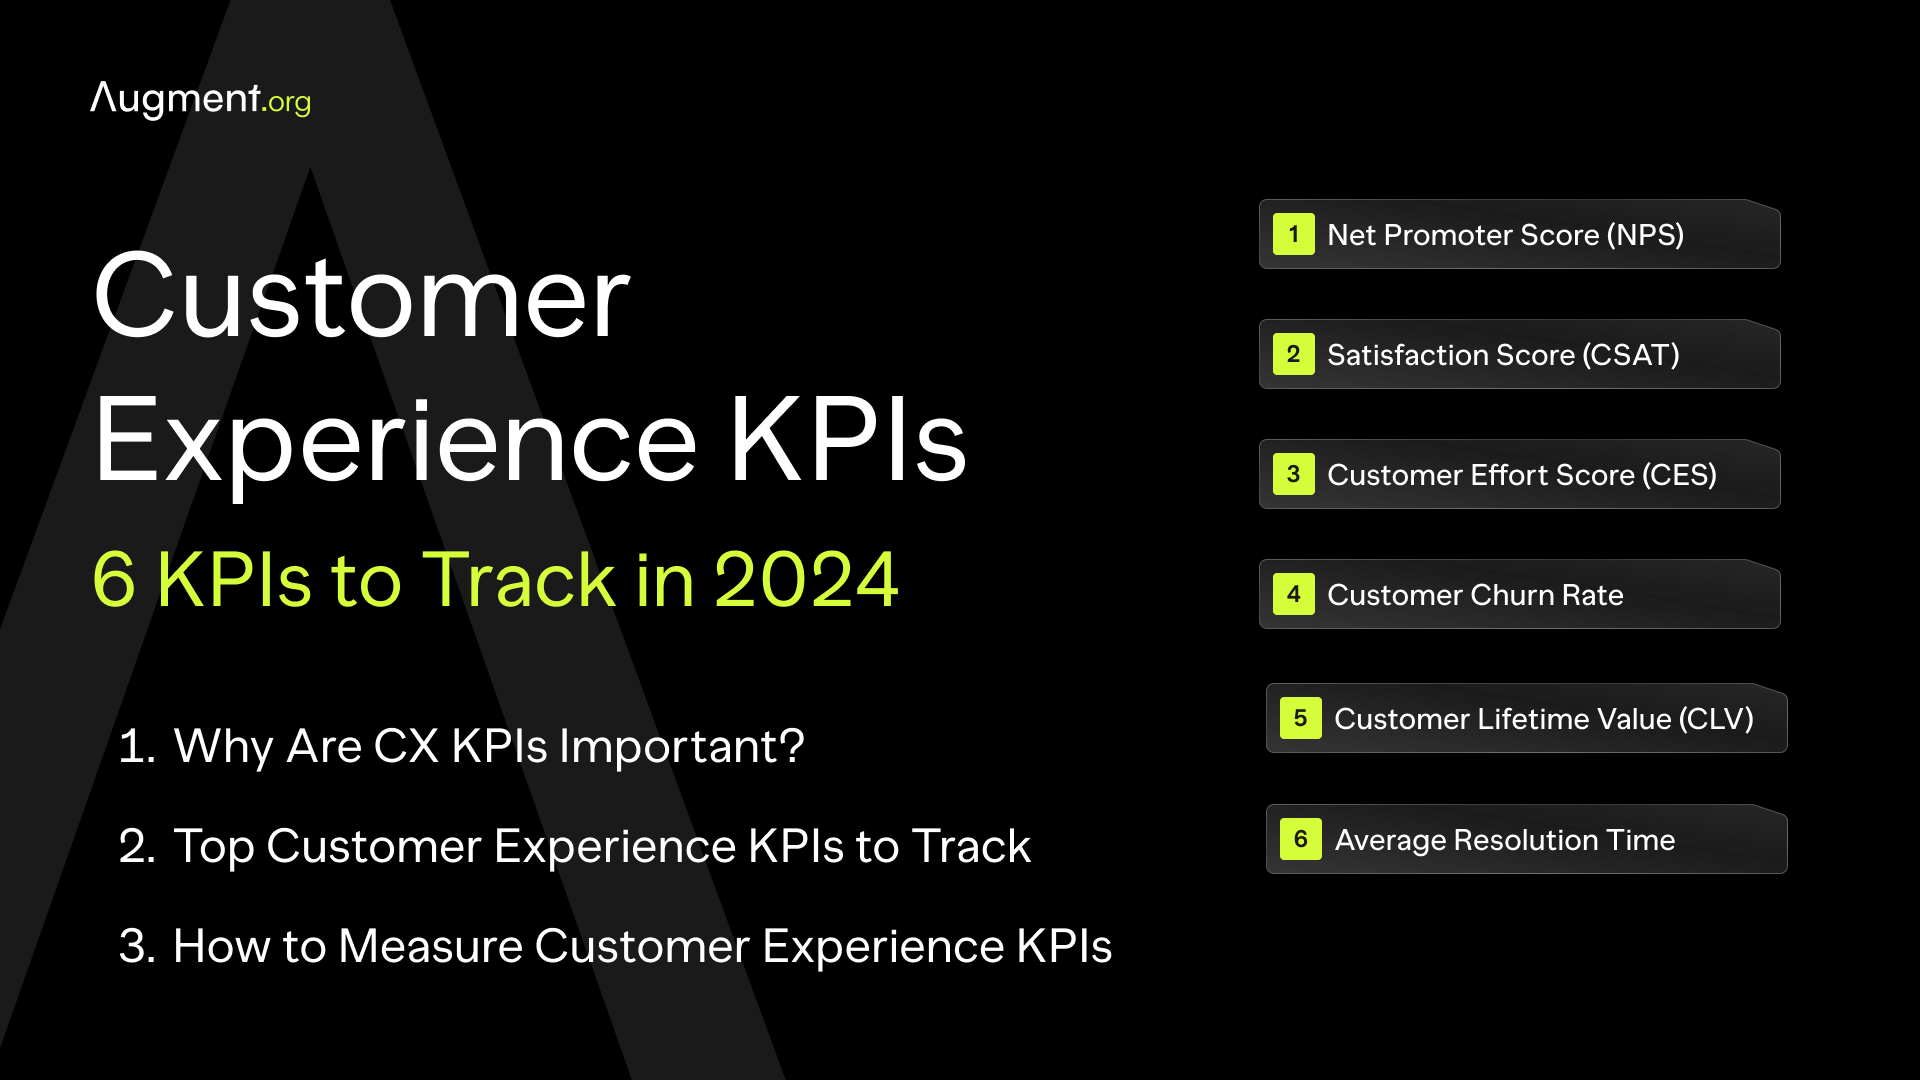
- Net Promoter Score (NPS): This measures customer loyalty and satisfaction. It's calculated based on responses to a single question: "How likely are you to recommend our company/product/service to a friend or colleague?" NPS categorizes customers into Promoters, Passives, and Detractors, offering a clear picture of customer sentiment and loyalty.
- Customer Satisfaction Score (CSAT): This score reflects how satisfied customers are with a company's products or services. It's typically measured through surveys asking customers to rate their satisfaction on a scale.
- Customer Effort Score (CES): CES gauges the ease of the customer experience. It asks customers to rate how much effort it took to interact with a company or use its product or service. Lower effort scores often correlate with higher customer satisfaction and loyalty.
- Customer Churn Rate: This metric tracks the rate at which customers stop doing business with a company. A high churn rate can signal issues in customer experience, while a low rate indicates effective customer retention strategies.
- Customer Lifetime Value (CLV): CLV predicts the total value a business can expect from a single customer account throughout their relationship. It helps in understanding the long-term value of maintaining good customer relationships.
- Average Resolution Time: This metric indicates how quickly customer issues are resolved. A lower average resolution time is generally associated with higher customer satisfaction.
By monitoring these KPIs, businesses can identify trends, understand customer needs, and make informed decisions to enhance the customer experience. These metrics are not just numbers; they are reflections of a customer's journey and relationship with the brand, directly impacting long-term business success.
How to Measure Customer Experience KPIs
Measuring Customer Experience KPIs effectively is crucial for gaining accurate insights into customer satisfaction and loyalty. Here’s how businesses can measure some of the key KPIs:
- Net Promoter Score (NPS): Conduct regular surveys asking customers the likelihood of recommending your business to others. Calculate NPS by subtracting the percentage of Detractors (those who score 0-6) from the percentage of Promoters (those who score 9-10).
- Customer Satisfaction Score (CSAT): Utilize post-interaction surveys with questions like, "How satisfied were you with our service today?" Customers rate their satisfaction on a scale, typically from 1 (very dissatisfied) to 5 (very satisfied).
- Customer Effort Score (CES): After resolution of a customer issue or interaction, ask customers to rate the effort required to get their issue resolved or need met. This is usually on a scale from "very easy" to "very difficult."
- Customer Churn Rate: Calculate the churn rate by dividing the number of customers lost during a specific period by the total number of customers at the start of that period. Multiply the result by 100 to get the percentage.
- Customer Lifetime Value (CLV): To compute CLV, multiply the average purchase value by the average number of purchases in a year and then multiply this number by the average customer lifespan.
- Average Resolution Time: Track the time taken to resolve customer issues from the moment they are reported. This is key for customer service teams to monitor and improve upon.
Each of these KPIs requires collecting data through customer interactions, feedback, and internal tracking systems. Regular analysis of this data helps in identifying trends, foreseeing customer needs, and implementing strategies to improve the overall customer experience. Remember, the goal is not just to collect data but to use it to create a more satisfying, effortless, and loyal customer relationship.
Tips for Optimizing the Customer Experience
Optimizing the customer experience is essential for businesses aiming to increase satisfaction, loyalty, and retention. Here are some actionable tips to enhance your customer experience strategy:
- Understand Customer Needs: Regularly collect and analyze customer feedback, survey responses, and support ticket data to identify customer pain points and expectations. This insight allows for more targeted improvements.
- Personalize the Experience: Tailor interactions based on customer lifetime value, purchase history, and preferences. Personalization can make customers feel valued, leading to increased satisfaction and loyalty.
- Improve Response Time: Fast and efficient responses to customer inquiries and problems can significantly enhance the customer experience. Monitor and strive to reduce average resolution time across all customer service channels.
- Invest in Employee Training: Ensure your support team is well-trained and equipped to handle customer issues effectively. Empowered employees are more likely to provide a positive experience for the customer.
- Leverage Technology: Utilize technology like CRM systems and analytics tools to track customer experience metrics and gain real-time insights. This can help in quickly identifying trends and making necessary adjustments.
- Monitor Customer Churn: Keep an eye on customer churn rates. Understanding why customers leave can provide valuable information to prevent future churn and improve retention strategies.
- Focus on the Entire Customer Journey: Pay attention to each stage of the user journey, from initial contact to post-purchase support. Consistently good experiences across the journey build loyal customers.
- Continuously Adapt and Improve: The customer experience landscape is always evolving. Stay informed about new trends, customer preferences, and feedback to continuously refine your approach.
By implementing these strategies, businesses can create a more customer-centric experience, ultimately leading to happier customers, increased loyalty, and improved business success.


